library(tidyverse)
library(tidytuesdayR)
library(here)
library(paletteer)21
Overview
Second #tidytuesday. We are looking at emissions. Once again I am more interested in correlations than simply presenting totals with pretty shapes. This one left me with more questions than answers, but that is good too.
Set Up
Libraries
Paletteer is amazing for color palettes.
Import Data
tt_load worked this time.
emissions <- readRDS(here("tidytuesday2024", "tidy21", "emissions.rds"))Theme
Trying some new theme structures. We’ll see if my system is sustainable.
# ggplot theme
text_color <- "beige"
fill_color <- "#1f2d36"

theme_set(theme_minimal(
  base_family = "Liberation Mono",
  base_size = 12))

theme_update(
  panel.grid.major = element_blank(),
  panel.grid.minor = element_blank(),
  text = element_text(color = text_color),
  axis.text = element_text(color = text_color),
  strip.text = element_text(color = text_color),
  axis.title.x = element_text(margin = margin(10, 0, 0, 0)),
  axis.title.y = element_text(margin = margin(0, 10, 0, 0)),
  plot.title = element_text(hjust = 0),
  plot.title.position = "plot",
  plot.background = element_rect(fill = fill_color, color = NA),
  plot.margin = margin(rep(5, 4)),
  panel.background = element_rect(fill = fill_color, color = NA),
  legend.background = element_rect(fill = fill_color, color = NA),
  legend.key = element_rect(fill = fill_color, color = NA),
  strip.background = element_rect(fill = fill_color, color = NA)
  )
EDA
Units
This whole data set relies on normalizing units across very different production industries. I wanted to start by assessing what these all were.
# How many of each commodity?
prods <- emissions %>%
  group_by(commodity) %>%
  summarize(count = n()) %>%
  ungroup()

# How many of each production unit?
prod_units <- emissions %>%
  group_by(production_unit) %>%
  summarize(count = n()) %>%
  ungroup()
Are Emissions Rates Standardized?
I want to check and see if each production unit has a standardized emissions conversion rate. We should see linearity in a production unit vs emissions scatter plot, grouped by units of production.
# Is the relationship between each production_unit and total emissions linear?
emissions_prodgrp <- emissions %>%
  group_by(production_unit)

ggplot(
  emissions_prodgrp,
  aes(
    x = production_value,
    y = total_emissions_MtCO2e,
    color = production_unit
    )
  ) +
  geom_point() +
  labs(
    title = "Emissions Rate by Production Unit",
    x = "Total Emissions",
    y = "Amount Produced",
    color = "Production Unit"
    ) +
  scale_colour_paletteer_d("LaCroixColoR::PeachPear")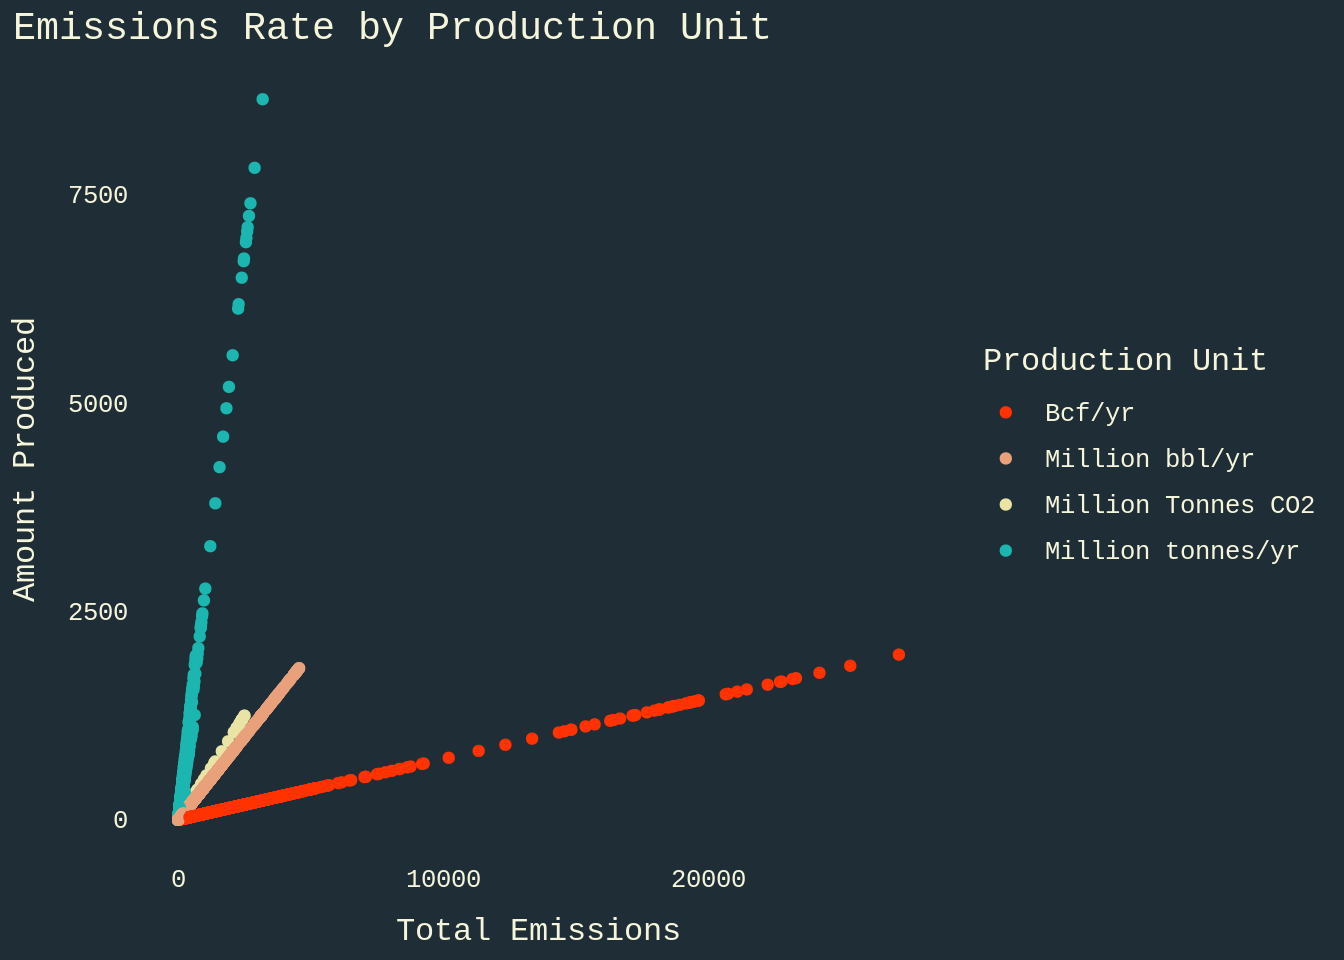
And this is what we see, barring a few deviations.
This confirms that emissions are calculated based on standardized rates specific to each commodity. Which makes sense considering we have historical data going back earlier than greenhouse gasses were effectively measured.
Calculate Rates
Now we can calculate the actual rate for each commodity. This will give us the number used by Carbon Majors in normalizing each commodity to a common unit of emissions (MtCO2). We can plot this like a GCMS plot and see if there are any outliers or minor ridges.
# What is the linear relationship between each production_unit wrt/ total_emissions?
unit_slope <- emissions %>%
  mutate(slope = total_emissions_MtCO2e/production_value)

# What is the variance of this slope wrt/ each production_unit
ggplot(
  unit_slope %>% group_by(production_unit),
  aes(
    x = slope,
    color = production_unit)
  ) +
  geom_freqpoly(binwidth = .01) +
  labs(
    title = "Variance in Emissions Rate",
    x = "Emissions Rate",
    y = "Frequency",
    color = "Production Unit"
    ) +
  scale_colour_paletteer_d("LaCroixColoR::PeachPear")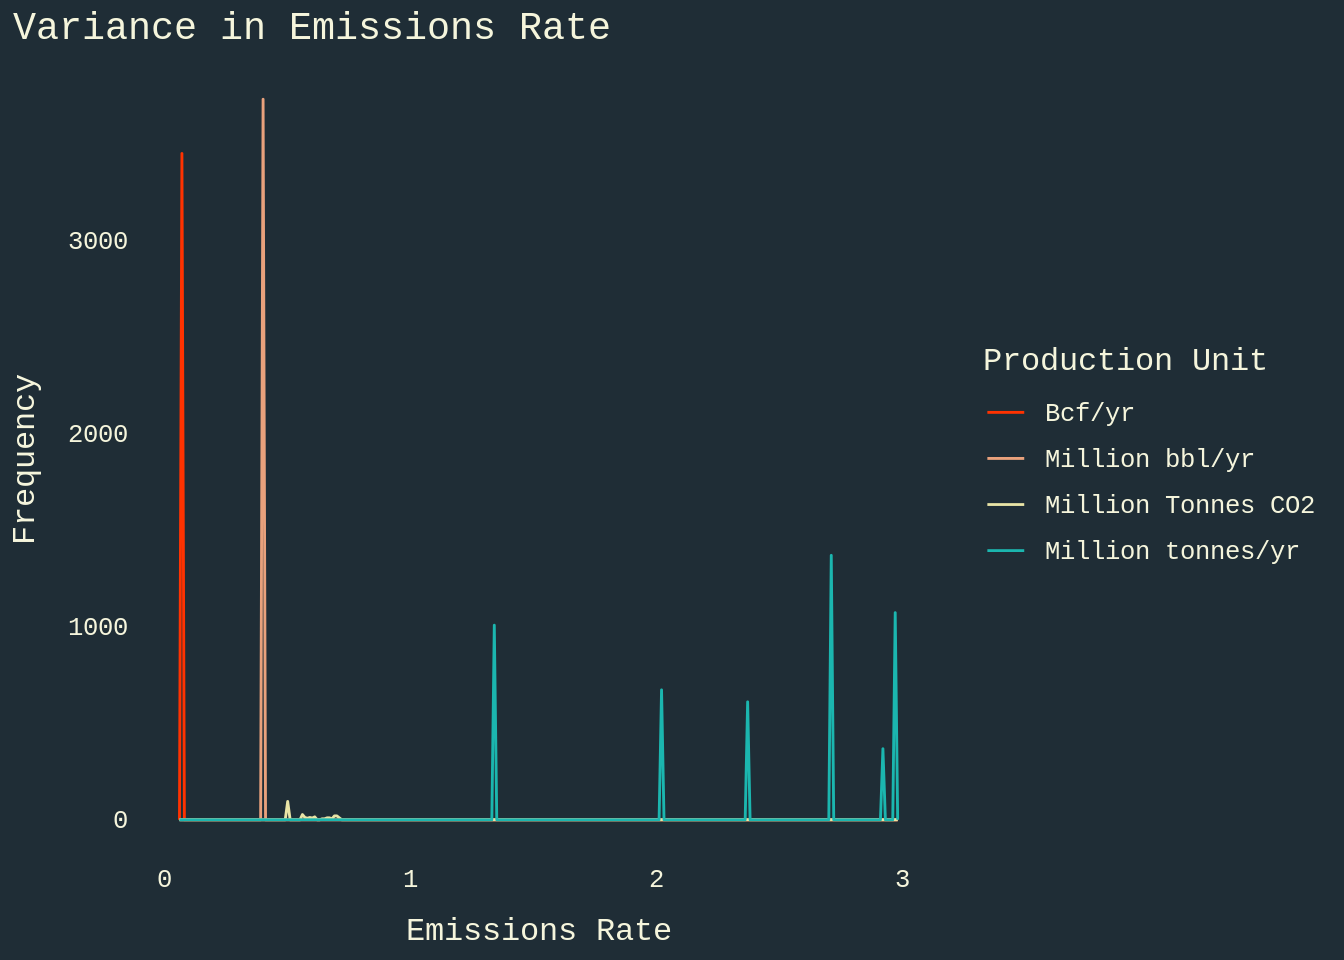
Coal
Coal seems to have a number of different conversion rates. My guess is that these vary based on the type of coal. We can group by commodity and show that in a histogram.
# Closer look at "Million tonnes/yr"
mtyr <- unit_slope %>%
  filter(production_unit == "Million tonnes/yr")

ggplot(
  mtyr %>% group_by(commodity),
  aes(x = slope,
      fill = commodity)
  ) +
  geom_histogram(
    color = "beige",
    binwidth = .1
    ) +
  labs(
    title = "Coal Emission Rate Variance",
    x = "Emissions Rate",
    y = "Frequency",
    fill = "Commodity"
    ) +
  scale_fill_paletteer_d("LaCroixColoR::Pamplemousse")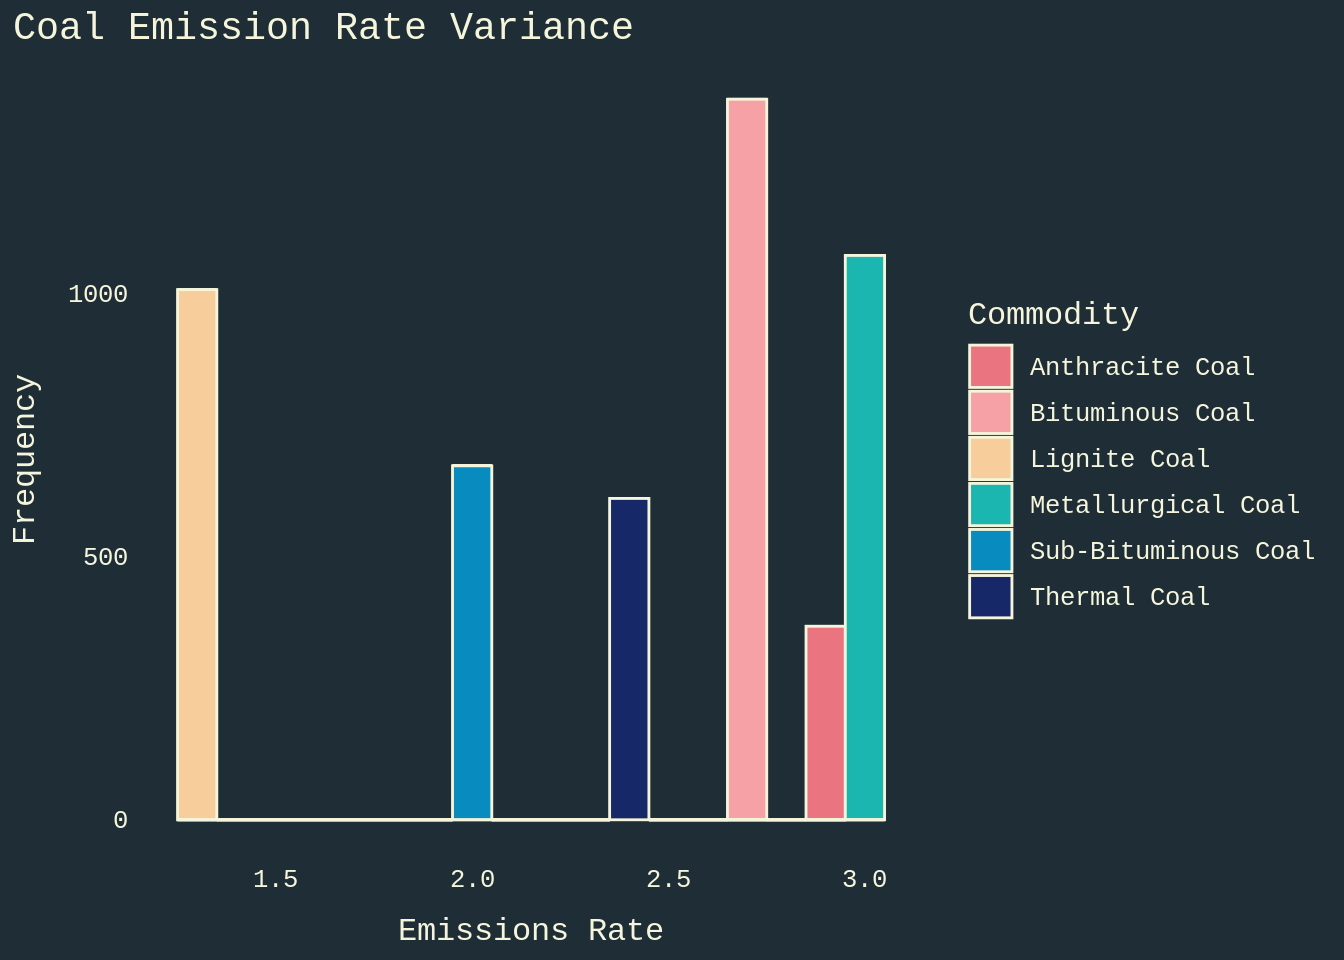
Cement
Cement is a bit different. It is one commodity. Grouping by Parent Company does not show a consistent correlation to the different rates.
# Closer look at "Million Tonnes CO2"
mtco2 <- unit_slope %>%
  filter(production_unit == "Million Tonnes CO2")

ggplot(
  mtco2 %>% group_by(commodity),
  aes(
    x = slope,
    fill = parent_entity)
  ) +
  geom_histogram(
    color = "beige",
    binwidth = .01
    ) +
  labs(
    title = "Cement Emissions Rate Variance",
    x = "Emissions Rate",
    y = "Frequency",
    fill = "Parent Entity"
    ) +
  scale_fill_paletteer_d("LaCroixColoR::Pamplemousse")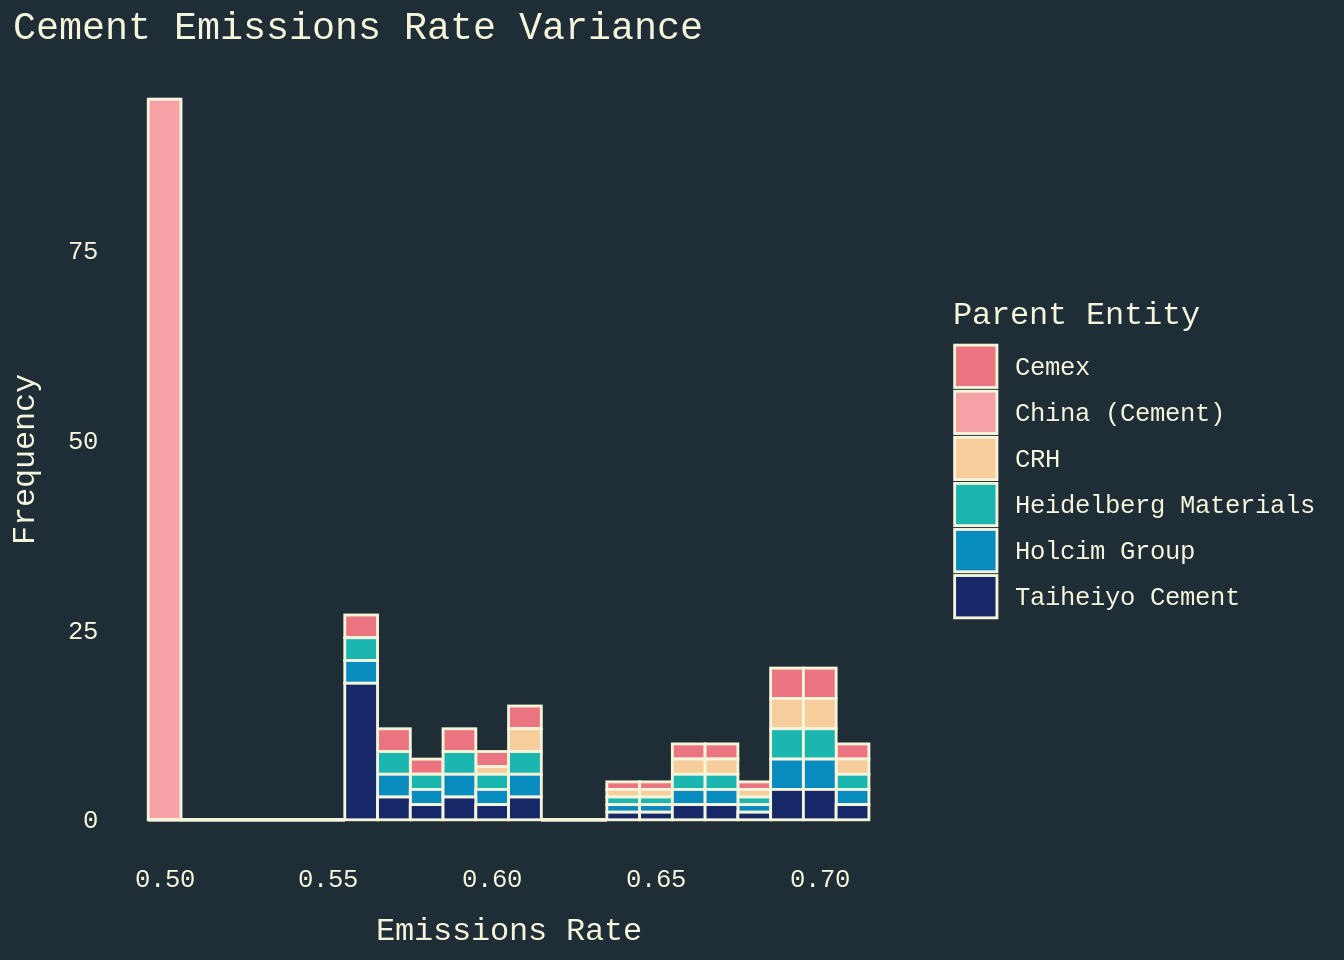
My guess is that we may see the variance in emmisions rate of cement correlate with time.
Results
# Date correlation for cement slopes
ggplot(
  mtco2,
  aes(
    x = year,
    y = slope,
    color = parent_entity)
  ) +
  geom_point() +
  facet_wrap(~ parent_entity) +
  labs(
    title = "Cement Emissions Rate Trend by Parent Entity",
    x = "Cement Emissions Rate",
    y = "Year"
    ) +
  scale_x_continuous(
    breaks = seq(1930, max(mtco2$year), by = 30)) +
  scale_color_paletteer_d("tvthemes::Opal") +
  theme(
    axis.text.x = element_text(angle = 90, hjust = 1),
    legend.position = "none",
    panel.border = element_rect(
      color = "beige",
      fill = NA, linewidth = 1)
  )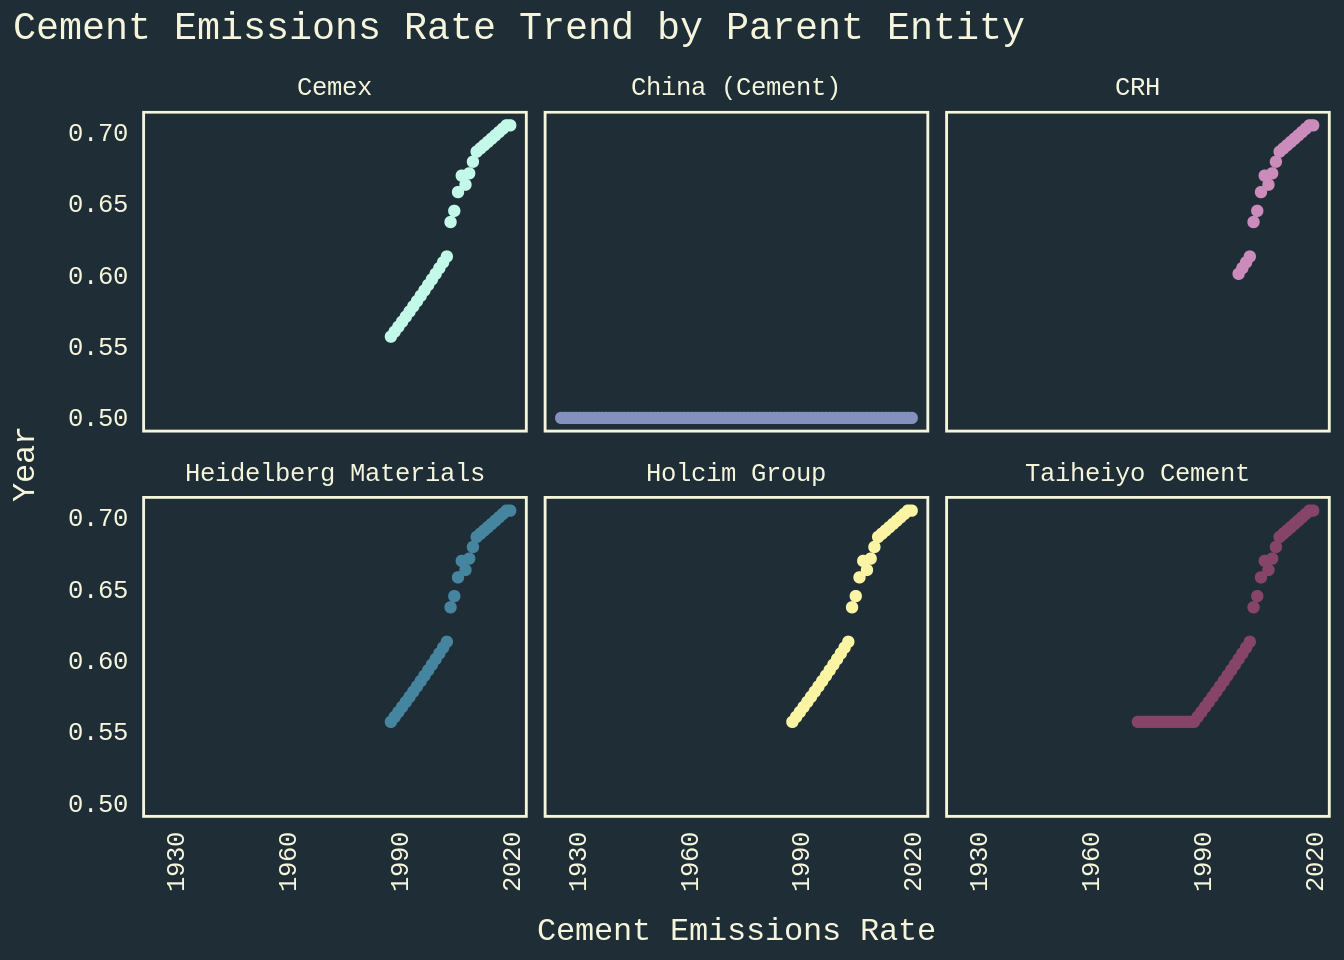
And that is precisely what we see.
With one major exception…
China Cement’s emissions rate has not changed since 1929. Carbon Majors does not provide an explanation for why this number has increased over time for the other five Parent Entities. Nor do they explain why China’s has stayed the same.
It appears the standard rate of emissions from cement production was established around 1970 (Taiheiyo Cement) and was steadily upgraded each year. I am assuming this was done by a governing body to which China does not ascribe. The question I am left with is this: Has the actual rate of emissions produced by cement production increased, or simply the rate agreed upon by the scientific community to use in calculating it? If the latter is the case, why has historical data not been recalculated. If the former is the case, why has cement production gotten worse in terms of emissions? And how has China’s rate remained flat while that of all the other Parent Entities steadily increased at the EXACT same rate?